
E-commerce Data Engineering
Customer 360° Data Warehouse: E-commerce & Retail Analytics Case Study
How incremental transformations, star-schema modelling, SCD Type 2 history, and automated data-quality tests turn scattered e-commerce data into a trusted Customer 360° view.
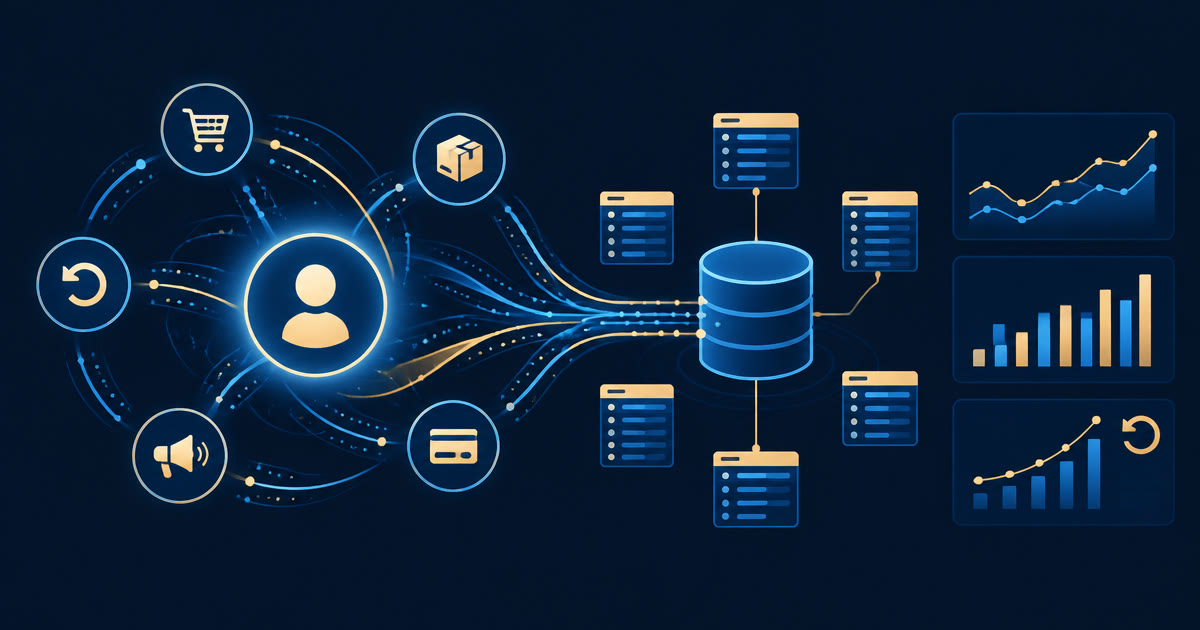
E-commerce businesses know their customers in fragments: the store knows what they bought, the marketing platform knows what they clicked, the returns system knows what they sent back. A Customer 360° data warehouse joins those fragments into one trusted, historical view of every customer — and this case study shows exactly how data engineering makes that possible.
Why data engineering matters in e-commerce and retail
Retail decisions live and die on customer understanding: Who are my repeat buyers? Which products drive returns? What is a customer actually worth over time? The answers sit across disconnected systems — the storefront, order management, product catalogue, returns processing, and marketing platforms.
Data engineering builds the centralised analytical warehouse that integrates all of these, keeps history as customer attributes change, and guarantees the numbers can be trusted before anyone acts on them.
Fragmented customer view
Customer identities and attributes were scattered across storefront, marketing, and support systems with no single profile.
Disconnected orders & returns
Sales performance and return behaviour could not be analysed together, hiding the true profitability of products and campaigns.
No history
When a customer changed address, segment, or status, the old value was overwritten — making trend and cohort analysis impossible.
Untrusted numbers
Without automated quality tests, broken loads and mismatched totals quietly reached business reports.
Step 1 — Integrating every dataset into one warehouse
The foundation is a centralised analytical data warehouse that brings together five core domains:
- Customers — profiles, segments, contact details, and lifecycle status
- Orders — order headers and line items with prices, discounts, and channels
- Products — catalogue, categories, brands, and cost data
- Returns — return reasons, refund values, and restocking outcomes
- Marketing — campaigns, channels, spend, and attribution touchpoints
Each source lands in the warehouse with its original structure preserved, then flows through standardised transformation layers into analytics-ready models.
Step 2 — Incremental transformations for scale
Reloading entire tables every day does not scale. The platform uses incremental data transformations: each run processes only new or changed records since the last successful load, using timestamps and change keys.
- Pipeline runs stay fast and cheap even as order volumes grow.
- Failures are isolated — a bad batch is reprocessed without touching good data.
- Daily (or more frequent) refreshes keep dashboards current without full reloads.
Step 3 — Star-schema modelling and SCD Type 2 history
The warehouse is modelled as a star schema: fact tables capture measurable events (orders, order lines, returns, marketing touches), while dimension tables describe customers, products, dates, channels, and campaigns.
The critical design decision is Slowly Changing Dimension Type 2 (SCD Type 2) on the customer dimension. Instead of overwriting a customer's segment, region, or status when it changes, the warehouse closes the old row with an end date and opens a new one. This preserves complete history:
- Analyse what a customer was — not just what they are — at the time of any order.
- Track segment migration: how many standard customers became VIPs this year?
- Reproduce any historical report exactly as it looked on the day it ran.
Step 4 — Automated data-quality tests
Trust is engineered, not assumed. Every pipeline run executes automated quality tests before data is published to analysts:
Uniqueness
Primary keys such as order ID and customer ID must never repeat.
Null checks
Critical fields — order value, customer key, product key — must always be populated.
Referential integrity
Every order line must point to a real customer and a real product.
Accepted values
Statuses, channels, and return reasons must come from approved lists.
Source-to-target reconciliation
Row counts and value totals are compared between source systems and the warehouse on every load.
Freshness
Datasets must arrive within their expected schedule, or alerts fire.
Failed tests quarantine the affected batch and alert the team — bad data never reaches a dashboard.
Step 5 — Analytical datasets that answer business questions
On top of the warehouse, purpose-built analytical datasets serve the metrics retail teams run on:
| Analytical dataset | Question it answers |
|---|---|
| Sales performance | Which products, categories, and channels drive revenue and margin? |
| Repeat purchase rate | How many customers come back, and how quickly? |
| Average order value | Are baskets growing, and which campaigns lift them? |
| Product returns | Which products and reasons drive return costs? |
| Customer purchasing behaviour | Who are the high-value, at-risk, and one-time customers? |
Business outcomes
One customer, one truth
Every team — marketing, merchandising, support, finance — works from the same governed customer profile with full history.
Profitable growth decisions
Repeat purchase rate, average order value, and return behaviour together reveal which customers and products actually make money.
Trusted reporting
Automated quality tests and reconciliation mean leaders debate strategy, not whose spreadsheet is correct.
A platform that scales
Incremental pipelines and star-schema modelling absorb growing order volumes and new data sources without re-engineering.
Key takeaways — the use of data engineering in retail
- Customer 360° is an engineering product. Integration, modelling, and quality testing — not a dashboard tool — create the single customer view.
- History is a feature. SCD Type 2 turns the customer dimension into a time machine for cohort and trend analysis.
- Incremental beats full reload. Processing only what changed keeps pipelines fast, cheap, and reliable at scale.
- Quality tests are the contract. Uniqueness, nulls, referential integrity, accepted values, and reconciliation are what make numbers believable.
Build your Customer 360°
Turn scattered retail data into one trusted customer view.
EdgeWave Software designs and delivers analytical data warehouses — integration, star-schema modelling, SCD history, and automated quality — on Databricks, AWS, and Azure.
Talk to our teamRelated reading and official references
- EdgeWave: Hotel Booking & Revenue Analytics: A Data Engineering Case Study
- EdgeWave: Top 5 Big Data Analytics Companies in India (2026)
- EdgeWave: Databricks Lakehouse Architecture — A Practical Enterprise Blueprint
- EdgeWave: Real-Time Payment Transaction Processing with Databricks & PySpark: A Streaming Case Study
- Kimball Group: Dimensional modeling techniques
- Slowly changing dimensions (SCD) explained